Trajectory SP867
Force field:
martini_v2.2
Simulation length (ns): 5000
Electric field (kJ mol-1 nm-1 e-1): 0
Temperature (K): 300 (v-rescale)
Pressure (bar): 1 (Parrinello-rahman semiisotropic)
Number of particles: 17380
Time step (fs) : 25
Software: GROMACS 2021.5
Simulation length (ns): 5000
Electric field (kJ mol-1 nm-1 e-1): 0
Temperature (K): 300 (v-rescale)
Pressure (bar): 1 (Parrinello-rahman semiisotropic)
Number of particles: 17380
Time step (fs) : 25
Software: GROMACS 2021.5
Supercomputer:
Finisterrae III CESGA
Peptides: P223 NC02212
Lipids: POPE, POPG
Heteromolecules:
Ions: NA
Water model: W
Peptides: P223 NC02212
Lipids: POPE, POPG
Heteromolecules:
Ions: NA
Water model: W
Sequence :
KLALKLALKAWKAALKLA
Total charge (e): +5
Number of residues: 18
By amino acid: Basic: 5 Acidic: 0 Hydrophobic: 13 Polar: 0 Electrostatic Dipolar Moment (e nm): 5.28
Longitudinal (e nm): 4.82 Transversal (e nm): 2.16 Hydrophobic Dipolar Moment (nm): 1.03
Longitudinal (nm): 0.42 Transversal (nm): 0.94 Secondary structure: Helix
Activity:
Download Files
ITP file. JSON file. PDB file.
Click on any component to highlight it from the plot.
Upper leaflet
Lower leaflet
Lipids
Membrane model for: POPG:POPE (1:3) (Gram-negative bacteria)
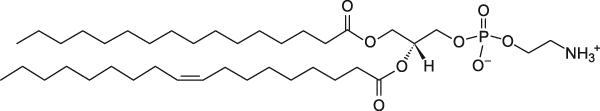
POPE
1-Palmitoyl-2-oleoyl-sn-glycero-3-phosphoethanolamine
Total charge (e): 0
See POPE lipid
Download ITP File. Download PDB File.
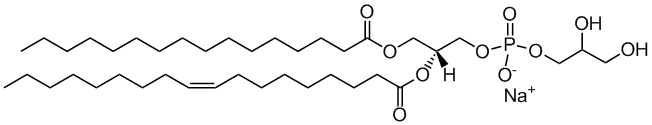
POPG
1-palmitoyl-2-oleoyl-sn-glycero-3-phosphoglycerol
Total charge (e): -1
See POPG lipid
Download ITP File. Download PDB File.
Last snapshot
Total contacts per residue
Molecular Dynamics based descriptors
Average and standard deviation,
calculated using the autocorrelation function (for time
series)
or the width of the distribution, for the last microsecond
of
the trajectory
Area per lipid
Membrane (nm2): 0.606153000 ± 0.000745381
Upper leaflet (nm2): 0.606153000 ± 0.000745381
Lower leaflet (nm2): 0.606153000 ± 0.000745381
Average Z coordinate
Peptide (nm): 8.4677900 ± 0.0378575
First Residue (nm): 8.4316300 ± 0.0472438
Last Residue (nm): 8.4944500 ± 0.0461028
Membrane (nm): 6.51827000 ± 0.00823271
Upper leaflet Head Group (nm): 8.54645000 ± 0.00988757
Lower leaflet Head Group (nm): 4.49175000 ± 0.00672592
Bilayer Thickness (nm): 4.0547000 ± 0.0119583
Peptide insertion (nm): -0.0786577 ± 0.0391274
Contacts
Peptide - Water: 24.337500 ± 0.863966
Peptide - Head groups: 13.047500 ± 0.330528
Peptide - Tail groups: 10.677500 ± 0.205291
Tilt (°): 85.46400 ± 1.06774
PepDF:
5(ns): CVS
Displacement (nm): 0.6327620 ± 0.0262537
Precession(°): 0.989918 ± 1.754520
50(ns) CVS
Displacement (nm): 1.8833800 ± 0.0917187
Precession(°): 6.26240 ± 6.16516
100(ns) CVS
Displacement(nm): 2.726580 ± 0.114866
Precession(°): 6.83943 ± 10.02460
200(ns) CVS
Displacement(nm): 3.945160 ± 0.174712
Precession(°): 16.8267 ± 13.4728
Download JSON File.
Peptide Analyses
Peptide Displacement Fingerprint
(PepDF)
Lateral displacement vs
Rotational
Displacement along the trajectory, for different time
windows .
Density maps:
2D-density maps of lipids around the
peptide
along XY and YZ axis, calculated for each lipid type along the
last
microsecond.
Lipid-Peptide Analyses:
z-Position
Z-coordinate, averaged for
differetn
parts of the the system: peptide, membrane, first and
last
backbone (BB) residues and upper of lower leaflet
lipids’
headgroups (HGs).
Minimum distance
Minimum distance (nm) between the
peptide backbone and the lipids (headgroups and
tailgroups).
Number of contacts
Number of contacts between the
peptide backbone and the water or the lipids separated
by
lipid headgroups (HG) or lipid tails, using a cut-off of
0.6
nm.
Lateral density
Lateral density for the different
components of the system: headgroups, tail groups,
peptide
and water.