Trajectory SP793
Force field:
martini_v2.2
Simulation length (ns): 5000
Electric field (kJ mol-1 nm-1 e-1): 0
Temperature (K): 300 (v-rescale)
Pressure (bar): 1 (Parrinello-rahman semiisotropic)
Number of particles: 17381
Time step (fs) : 25
Software: GROMACS 2021.5
Simulation length (ns): 5000
Electric field (kJ mol-1 nm-1 e-1): 0
Temperature (K): 300 (v-rescale)
Pressure (bar): 1 (Parrinello-rahman semiisotropic)
Number of particles: 17381
Time step (fs) : 25
Software: GROMACS 2021.5
Supercomputer:
Finisterrae III CESGA
Peptides: P186 AP03747
Lipids: POPE, POPG
Heteromolecules:
Ions: NA
Water model: W
Peptides: P186 AP03747
Lipids: POPE, POPG
Heteromolecules:
Ions: NA
Water model: W
Sequence :
WKFGKKLERMGKRIFKATEKGLPVATGVAALARG
Total charge (e): +7
Number of residues: 34
By amino acid: Basic: 9 Acidic: 2 Hydrophobic: 21 Polar: 2 Electrostatic Dipolar Moment (e nm): 10.98
Longitudinal (e nm): 10.16 Transversal (e nm): 4.18 Hydrophobic Dipolar Moment (nm): 3.6
Longitudinal (nm): 2.69 Transversal (nm): 2.39 Secondary structure: Helix
Activity:
Download Files
ITP file. JSON file. PDB file.
Click on any component to highlight it from the plot.
Upper leaflet
Lower leaflet
Lipids
Membrane model for: POPG:POPE (1:3) (Gram-negative bacteria)
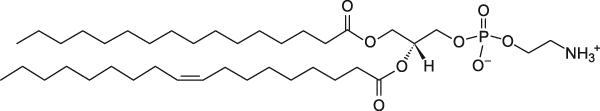
POPE
1-Palmitoyl-2-oleoyl-sn-glycero-3-phosphoethanolamine
Total charge (e): 0
See POPE lipid
Download ITP File. Download PDB File.
POPG
1-palmitoyl-2-oleoyl-sn-glycero-3-phosphoglycerol
Total charge (e): -1
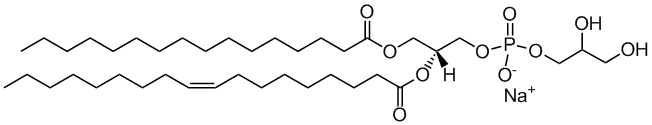
See POPG lipid
Download ITP File. Download PDB File.
Last snapshot
Total contacts per residue
Molecular Dynamics based descriptors
Average and standard deviation,
calculated using the autocorrelation function (for time
series)
or the width of the distribution, for the last microsecond
of
the trajectory
Area per lipid
Membrane (nm2): 0.607247000 ± 0.000859127
Upper leaflet (nm2): 0.607247000 ± 0.000859127
Lower leaflet (nm2): 0.607247000 ± 0.000859127
Average Z coordinate
Peptide (nm): 8.4832800 ± 0.0295077
First Residue (nm): 8.5835800 ± 0.0465194
Last Residue (nm): 8.7594300 ± 0.0412653
Membrane (nm): 6.50166000 ± 0.00874134
Upper leaflet Head Group (nm): 8.527890 ± 0.010583
Lower leaflet Head Group (nm): 4.4783200 ± 0.0072117
Bilayer Thickness (nm): 4.0495700 ± 0.0128066
Peptide insertion (nm): -0.0446115 ± 0.0313482
Contacts
Peptide - Water: 45.06500 ± 1.10923
Peptide - Head groups: 20.862500 ± 0.461555
Peptide - Tail groups: 18.132500 ± 0.356044
Tilt (°): 88.810200 ± 0.793463
PepDF:
5(ns): CVS
Displacement (nm): 0.5449300 ± 0.0225495
Precession(°): 0.0531347 ± 0.8309380
50(ns) CVS
Displacement (nm): 1.7349900 ± 0.0822333
Precession(°): 0.193517 ± 2.376440
100(ns) CVS
Displacement(nm): 2.600620 ± 0.118101
Precession(°): 0.260299 ± 3.267110
200(ns) CVS
Displacement(nm): 3.411280 ± 0.184283
Precession(°): 3.33173 ± 4.71340
Download JSON File.
Peptide Analyses
Peptide Displacement Fingerprint
(PepDF)
Lateral displacement vs
Rotational
Displacement along the trajectory, for different time
windows .
Density maps:
2D-density maps of lipids around the
peptide
along XY and YZ axis, calculated for each lipid type along the
last
microsecond.
Lipid-Peptide Analyses:
z-Position
Z-coordinate, averaged for
differetn
parts of the the system: peptide, membrane, first and
last
backbone (BB) residues and upper of lower leaflet
lipids’
headgroups (HGs).
Minimum distance
Minimum distance (nm) between the
peptide backbone and the lipids (headgroups and
tailgroups).
Number of contacts
Number of contacts between the
peptide backbone and the water or the lipids separated
by
lipid headgroups (HG) or lipid tails, using a cut-off of
0.6
nm.
Lateral density
Lateral density for the different
components of the system: headgroups, tail groups,
peptide
and water.